Recommendations
Benin
- Benin should closely monitor and significantly reduce its debt-to-GDP levels during the next period of sustained economic growth. Although this level of debt may be acceptable at the present time, lowering the debt-to-GDP ratio will allow the government to borrow more easily and at a lower rate to finance spending during future crises.
- Benin should work towards increasing its tax base by incentivising firms to move into the formal sector. This would allow the government to use fiscal policy more efficiently during crises and also reduce debt during periods of economic growth.
- Benin’s trade relations with Nigeria should be improved. This can be accomplished by improving monitoring of goods and services crossing land borders with the specific aim of reducing re-exports.
Togo
- Togo should implement governance reforms. All of the national crises in Togo have been associated with uncertainty regarding the country’s political institutions and it is difficult to implement counter-cyclical policies to offset the negative impact of governance crises on GDP.
- Creating more inclusive political and economic institutions could help to prevent political crises from arising.
- Togo should closely monitor inflation and maintain a low growth rate in the money supply. Contractionary policy may be required to prevent further increases in inflation.
Executive summary
This policy briefing provides a comparative analysis of the macroeconomic resilience of Benin and Togo to endogenous and exogenous shocks over a twenty-year period from 2000 to 2020. Both countries have experienced numerous shocks over this period; however, a small selection of shocks in each country have indeed resulted in negative growth. The overriding reason for analysing the impact of these shocks is to provide insights to policy makers on how best to enhance resilience in the two countries. Togo and Benin are compared as they are neighbouring Francophone countries of a similar size wedged between Anglophone regional powerhouses Ghana and Nigeria in West Africa. Both countries are also members of ECOWAS and WAEMU. Togo has been beset by governance crises for most of the period, whereas Benin has enjoyed a much greater level of political and economic stability. Nonetheless, it is interesting to note that Benin, because of its greater integration with the regional and global economy, has been more significantly impacted by shocks as demonstrated by its volatile GDP growth performance. Togo’s economic performance, in comparison, has been largely shielded by its key export, phosphates, which has strengthened its ability to apply counter-cyclical policies to smooth the impact of shocks on its economic performance.
Introduction
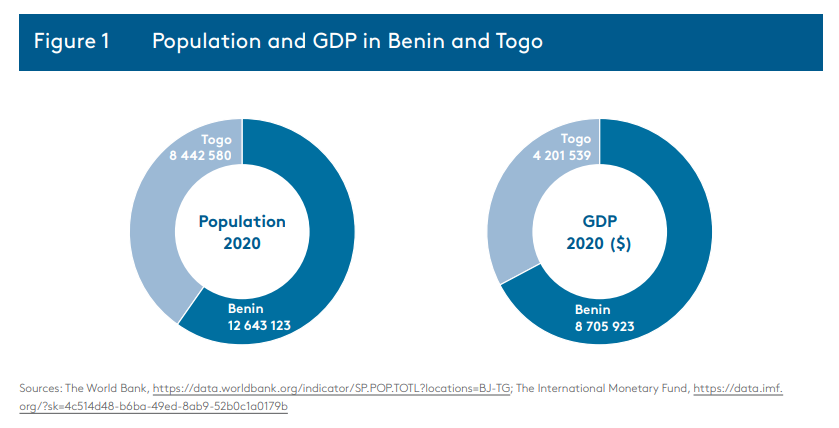
Togo is classified as a low-income country. It is one of the poorest countries in the world, ranked 195th of 214 countries with a GDP per capita of $ 918.4 in 2022.1The World Bank, ‘GDP per capita (current US$) – Togo, Benin | Data (worldbank.org)’, https://data.worldbank.org/indicator/NY.GDP.PCAP.CD?locations=TG-BJ. Benin, in contrast, was reclassified as a lower-middle-income country in 2019 from its former low-income status by the World Bank and had a GDP per capita of $ 1,303.2 in 2022.2The World Bank GDP per Capita; Republic of Benin, Ministry of Economy and Finance, Communique, ‘Benin is now a middle income country’, Benin, 7 March 2020. Figure 1 displays the relative size of the two countries in terms of their population and GDP in 2020. Benin is slightly bigger, both in terms of population and GDP, but geographically almost twice the size of Togo. When considering the composition of GDP in the two countries, we see in Figure 2 that both are net importers and the countries have similar ratios of consumption, government spending and investment to GDP. In both countries, the service sector is by far the largest sector and represented approximately 50% of domestic production in 2022.3The Central Bank of West African States, ‘GDP and its Components at Nominal Values’. Both countries’ exports are not very diversified. Togo’s largest exports are minerals and represent approximately 50% of exports.4United Nations, UN Comtrade Database, https://comtradeplus.un.org/ Benin’s largest export is cotton, which represents approximately 65% of exports.5United Nations, UN Comtrade Database. Both countries have high levels of poverty with 38% of the population of Benin and 45% of Togo’s population living in poverty in 2018.6The World Bank, ‘Poverty Headcount Ratio at National Poverty Lines (Percent of Population)– Togo, Benin’.

The nature of macroeconomic crises in Benin and Togo
This paper distinguishes between national crises that originate within the country and regional/global crises that originate outside the country and affect the region and/or the world. The most prominent regional/global crises observed in Benin and Togo include the 2008 global financial crisis, extensive flooding in West Africa in 2010, the outbreak of Ebola in 2014 in both countries, and the global COVID-19 crisis of 2020. Benin and Togo were not severely affected from a health perspective by either COVID-19 or Ebola, and neither country had a single case of Ebola, but both countries were affected by the global economic consequences of the pandemics.
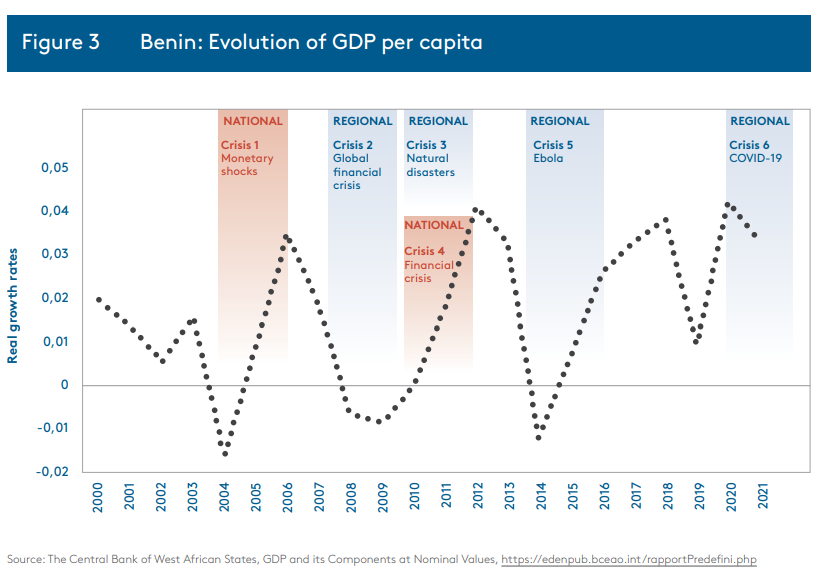
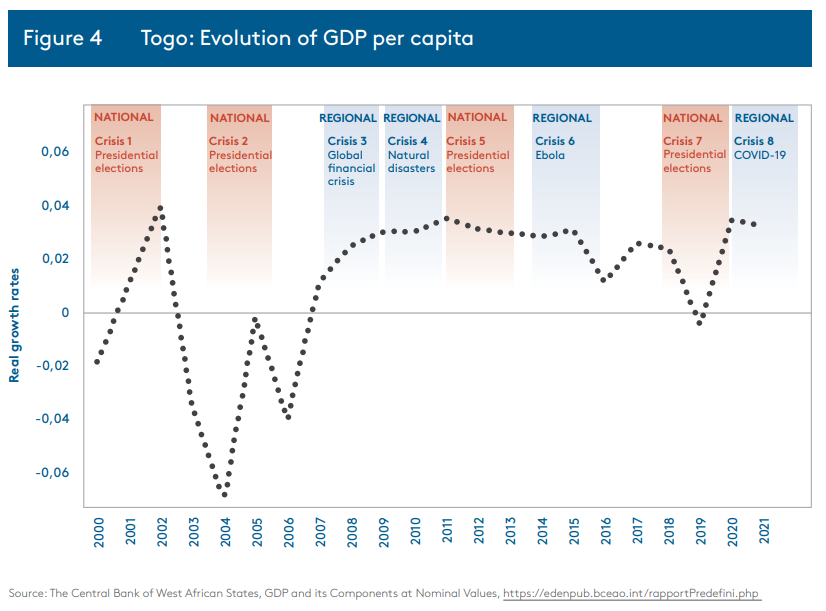
National crises which affected Benin during this period include a trade dispute with Nigeria in 2005 and political instability in the country surrounding the unsuccessful impeachment of President Boni Yayi because of his alleged involvement in a Ponzi scheme in 2010.7Reuters, ‘Benin president accused of role in Ponzi scheme’, https://www.reuters.com/article/benin-swindle-idUSLDE67I1RP20100819/. The trade dispute was due to Nigeria increasing the number of prohibited goods that could be imported in an attempt to limit the amount of goods being reimported from Benin into Nigeria.8African Development Bank (AFDB), ‘Benin Country Strategy Paper 2005-2009’, https://www.afdb.org/en/documents/document/2005-2009-benin-country-strategy-paper-12963. National crises in Togo during this period were almost entirely the result of political instability related to the country’s political institutions and elections occurring respectively in 2000, 2004, 2010, 2012 and 2020. Political instability was particularly evident from 2004, prior to the death of president Gnassingbé Eyadéma in 2005, who was controversially succeeded by his son Faure Gnassingbé Eyadéma after a brief interregnum following his father’s death.
Figures 3 and 4 plot the evolution of GDP per capita growth in Benin and Togo. The red shaded areas represent national crises and the blue areas represent regional/global crises. Overall, Benin’s economic performance was more volatile as it was seemingly more exposed to global and regional shocks than Togo’s economy. It is noteworthy that over the same time period both economies appeared to become more resilient to exogenous and endogenous shocks. In Benin, the economy did not experience negative growth rates after 2014 whereas in Togo, the country did not experience growth from 2007 to 2019.
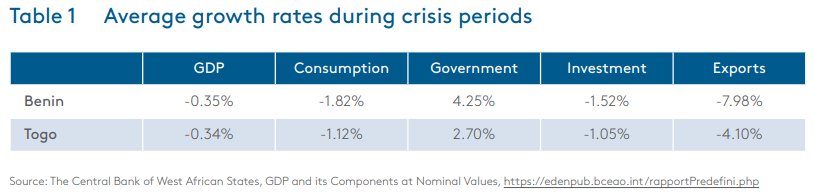
The crises in the two countries had varying impacts on the components of GDP. Table 1 presents the average growth rate of the components of GDP during the periods of crisis. In both Benin and Togo, consumption was negatively affected during periods of negative growth. Consumption declined slightly more in Benin than in Togo (approximately 2% and 1% respectively). However, there was a sharp contrast between the two countries with respect to government spending. The growth rate of government spending in Benin was 4.25% during periods of negative GDP growth. This was consistent with the government of Benin implementing counter-cyclical government spending to offset the negative effects of the crises. In Togo, a lower growth rate of government spending during these periods was apparent. Finally, we observe that investment and exports were more negatively affected in Benin during periods of crises than in Togo.
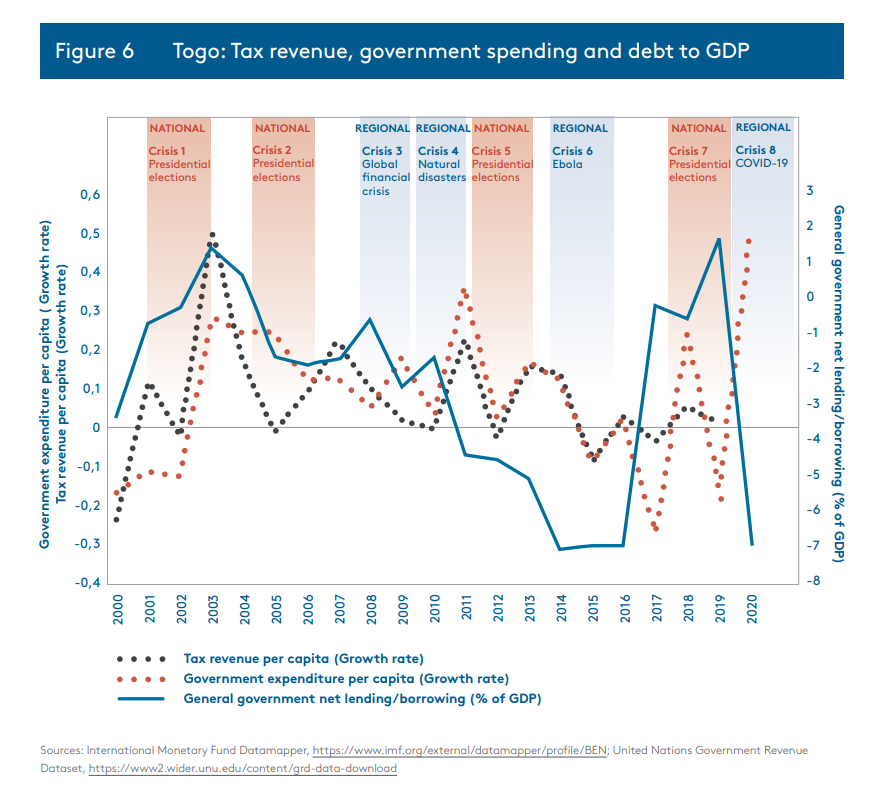
Figures 5 and 6 show fiscal policy response to economic fluctuations in Benin and Togo respectively. The figures plot the growth rates of tax revenue per person and government expenditure. Also included in the figures is net lending/borrowing as a percentage of GDP. In Benin, tax revenue tended to decline during periods of crises while government expenditure increased before decreasing following crises. This reflects responsible fiscal policy making. Also note the negative growth rate in tax revenue in 2012 in Benin. This could be explained by a reform to customs procedures at the Port of Cotonou that caused diversions of trade to ports in neighbouring countries.9International Monetary Fund, ‘Benin: Third Review Under the Extended Credit Facility Arrangement’, https://www.elibrary.imf.org/view/journals/002/2012/099/article-A001-en.xml#A01fig02. The reforms included ‘(i) a one-stop window at the Port of Cotonou; (ii) an enhanced import-value-verification program; and (iii) a customs-valuation system based on actual transactional values’.10IMF, Benin: Third Review. The government of Benin responded responsibly by reducing expenditure proportionally.
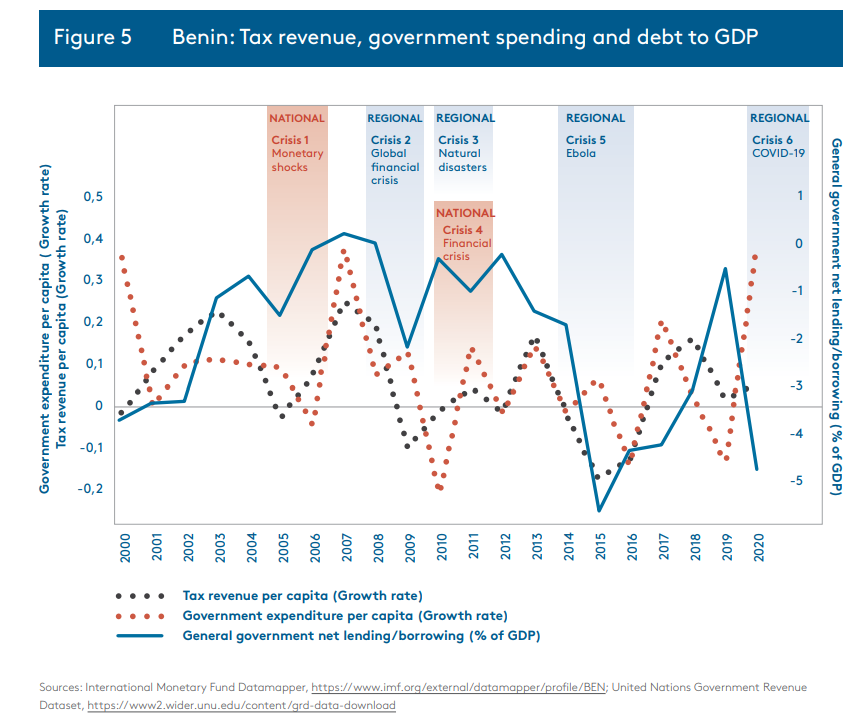
Consistent with the overall expenditure pattern, government net lending decreased during crisis periods and increased afterwards. This suggests that the government used debt to finance stimulus spending during crises and actively attempted to reduce the stock afterwards. However, it should be noted that debt stock had steadily increased from 2007 and accelerated during the pandemic. This can be seen by net lending which had been negative for almost the entire sample period. A negative net lending position implies that the government is borrowing. However, gross debt remained low for the region at 52% of GDP in 2023. It is important for the Benin government to make sure that it remains sustainable.11International Monetary Fund, ‘Central Government Gross Debt’, https://www.imf.org/external/datamapper/GGXWDG_NGDP@WEO/BEN?zoom=BEN&highlight=BEN.
For Togo, government spending tended to be procyclical during periods of national crises. The growth rate decreased during all national crises. During regional crises, government spending was less predictable. The only clear example of counter-cyclical government spending during regional crises was during the COVID-19 pandemic, which saw a large increase in the growth rate of government spending. In addition, tax revenue tended to be affected by national crises more than by global/regional crises. With the exception of the presidential elections in 2018, all national crises were associated with a negative growth rate in tax revenue. For global/regional crises we saw a negative growth rate for tax revenue during the flooding in 2010 and during the Ebola crisis.
As for net lending/borrowing, this appears to have been relatively unrelated to both national and global/regional crises. For the period 2008 to 2016, net lending declined dramatically. This indicates that the government spent more than the revenue it generated. Net borrowing increased dramatically prior to the 2018 national crisis, which indicates a relatively balanced budget with net lending being close to zero. Finally, net lending decreased dramatically during the COVID-19 crisis as a result of increased debt to finance counter-cyclical government spending.

Next, we consider the monetary policy response in the two countries by examining the growth rate of the money supply (M1) and the inflation rate. In Benin, money growth tended to increase during crises, with the only exception being the natural disasters in 2010 where the money supply declined (Figure 7). The expansions in the money supply generally induced large fluctuations in inflation although, since the beginning of 2014, inflation has been much more stable.
In Togo, the response of monetary policy to crises was less consistent than had been the case in Benin. During the first, second and third presidential elections, and the COVID-19 pandemic, monetary policy was expansionary (Figure 8).
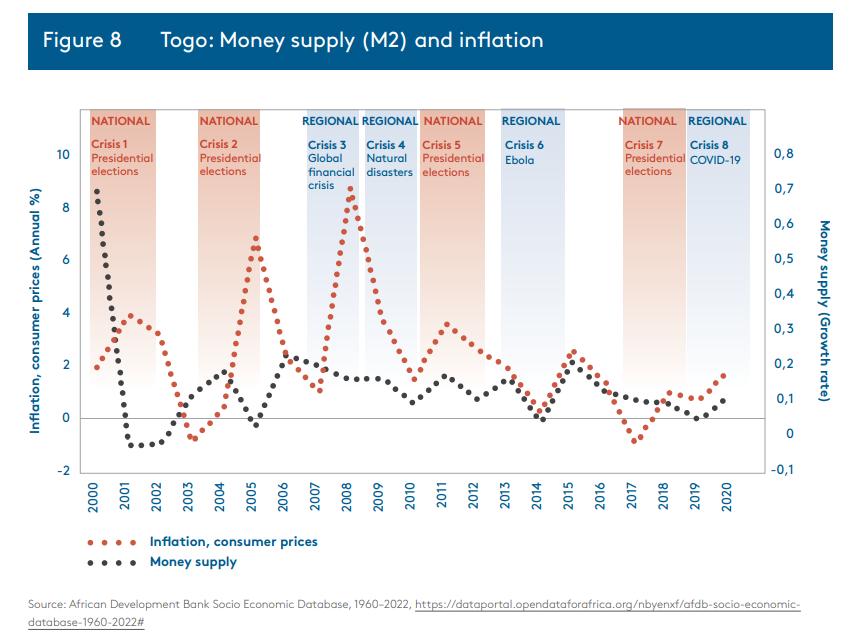
In addition, the growth rate of the money supply was quite high during the global financial crisis. A growth rate of approximately 20% from 2006 to 2009 was maintained. Finally, we observe counter-cyclical monetary policy during the Ebola crisis. Following the second crisis associated with the presidential election, expansionary monetary policy caused large increases in inflation. During the financial crisis, a large increase in the inflation rate could also be observed. In later years, inflation appears to have been better managed with expansionary monetary policy not leading to large increases in inflation. However, this trend appears to have been broken following the COVID-19 pandemic (not shown in the figure). In 2022, inflation reached 7.6% following the expansionary monetary policy during the COVID-19 crisis.12International Monetary Fund, ‘Inflation Rate, Average Consumer Prices’, https://www.imf.org/external/datamapper/PCPIPCH@WEO/BEN/TGO.
Acknowledgement
This work was carried out with the aid of a grant from the International Development Research Centre (IDRC), Ottawa, Canada. The South African Institute of International Affairs, CSEA and our think tank partners acknowledge the support of the IDRC for this research paper and the CoMPRA project.
The views expressed herein do not necessarily represent those of the IDRC or its Board of Governors.